- Revenue Dashboard
Revenue Dashboard
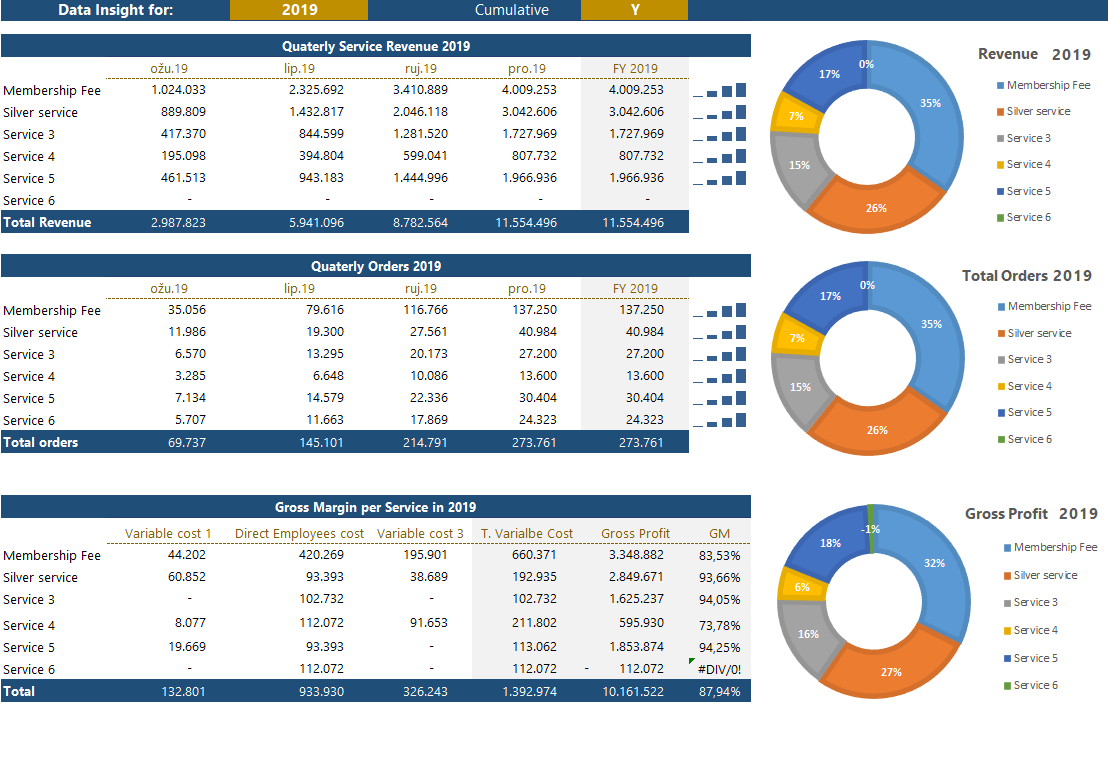
Revenue Dashboard gives more data insight into the composition of total revenue and estimated quarterly results for a given year.
Main features
- Quarterly data insight for revenue and orders every planned year.
- Ability to switch a cumulative or individual quarter view.
- A transparent Gross Margin composition per service.
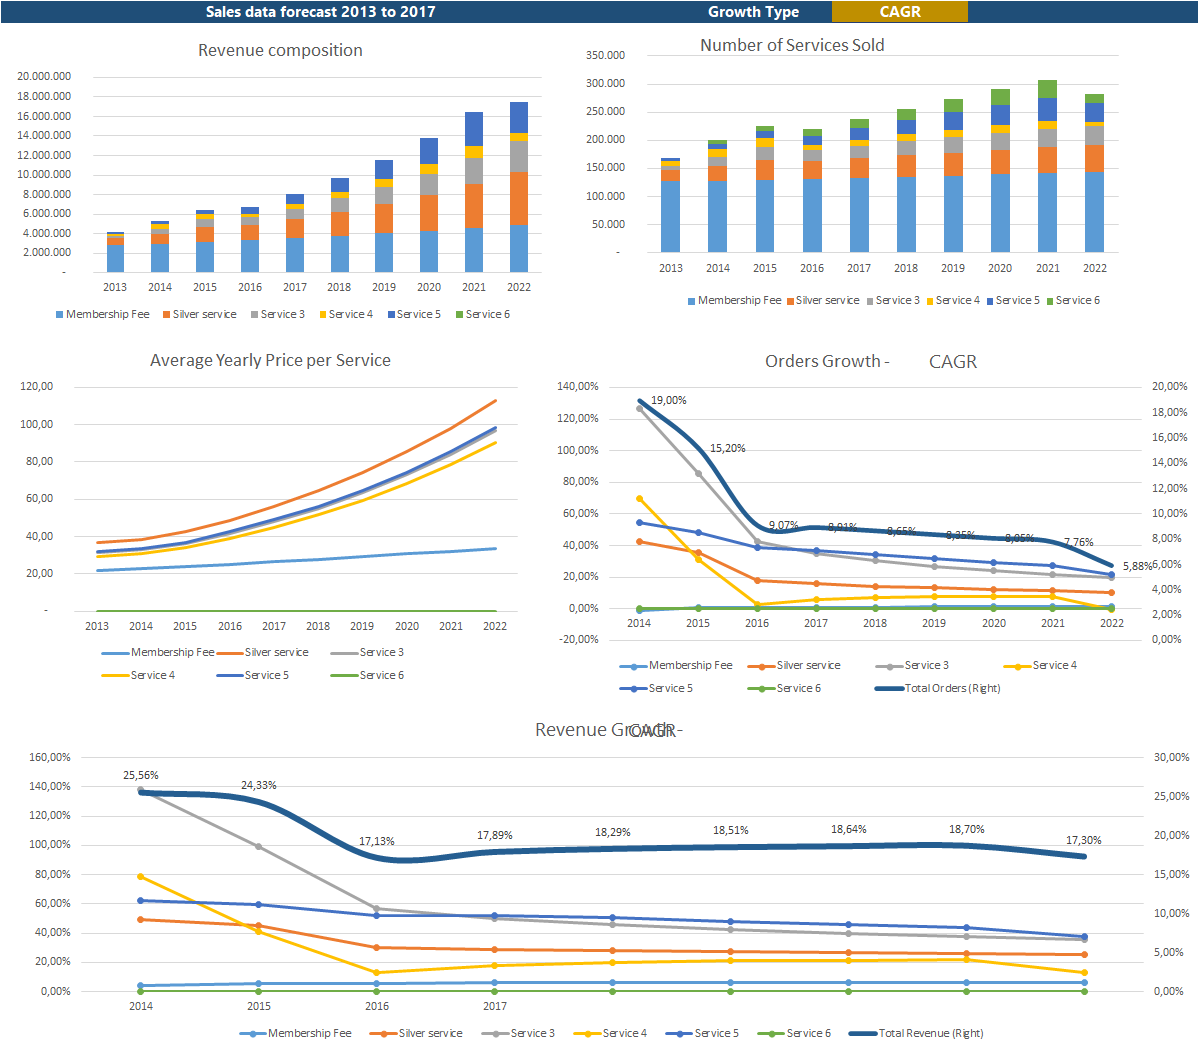
- Yearly view of each product order and revenue growth (CAGR or YoY)
Dynamic Dashboard
The right side of the Revenue Dashboard gives data insight about the estimated number of orders and revenue per Service or product on a quarterly level for each chosen year. Also, it gives a detailed composition of variable cost and respective gross margin for each service or product.
Dynamic Dashboard
Yearly Overview
On the left side, we placed an overview of orders and revenue composition for each planned year and changes in the price level for each service or product. Here you can see what are the main forces behind the overall revenue growth.
On this Dashboard, you can see the respective growth of orders and revenue for each service or product. From the dropdown menu, you can choose between year on year (y-o-y) or compound average growth rate (CAGR).
On this Dashboard, you can see the respective growth of orders and revenue for each service or product. From the dropdown menu, you can choose between year on year (y-o-y) or compound average growth rate (CAGR).


