Configuration
Main Configuration
The Main Configuration MS Excel sheet is used to enter some of the key information about financial planning.
Main features
- Ability to enter forecast beginning date and first reporting month
- Service or Product based model
- Ability to choose drivers for estimating revenue (customer or product-based level)
- Define monthly seasonality of units and price in order to tailor unique market trends
- Set a custom name for service (product) and expenses
- Set working capital assumption
- Choose between 2 business valuation methods.
Main Information and Timing
Before you even start making assumptions of your financial model, you need to define the start date and first reporting month of your financial statement. Once you enter the date and month, do not change them, otherwise, all financial models will not be valid.
For most companies, the first reporting month in financial statements is December (end of the calendar year). However, some companies choose half or first quarter, in order to capture full seasonal buyers cycle in one reporting year.
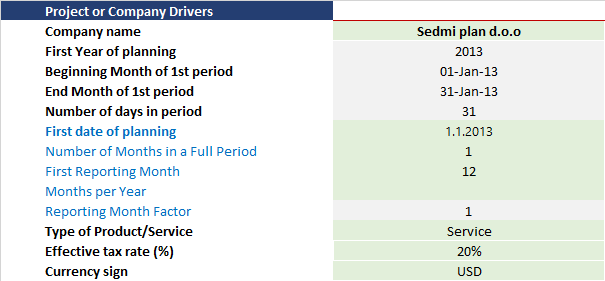
Company name: Enter your company name or project name
Type of product- choose Service if you develop a financial model for service, otherwise choose Product. The main difference is in product labels, but also in the calculation of stock for products.
Currency sign: used for labeling currency in financial reports
Effective Tax rate: Enter the corporate tax on gross profits. It is usually slightly different from the legally announced Tax rate due to many tax-exempts and allowances. For simplicity, you can enter the base tax rate. (currently, the model does not count for using previous years losses as the base of tax-exempt, but we will do it in next updates)
Effective Tax rate: Enter the corporate tax on gross profits. It is usually slightly different from the legally announced Tax rate due to many tax-exempts and allowances. For simplicity, you can enter the base tax rate. (currently, the model does not count for using previous years losses as the base of tax-exempt, but we will do it in next updates)
Main Information and Timeframe
Revenue Planning
This is an important assumption, as it determines the way how to estimate your future revenue from products or services. It usually depends on what kind of data is available for estimation. I would say that for most of the digital business models, where tracking the information about customers and the way they interact with your products or service, estimating revenue using a Customer base is mandatory.
Even, in traditional business models, where it is difficult to track such data, it is very helpful to estimate the approximation of the customer base level. It will give you extra layers of strategic thinking of your business concept. Traditional financial forecast of revenue relies only on the estimation of the number of units sales, seasonality, and average price of the product. If you have no clue about customers, or want to use sales numbers for service or product you already have, go with Product or Service level. After, you can always switch to customer level and see how many customers you need to achieve planned numbers. Cool :-)
If you opt for Customer level estimation, you can enter the number of starting customer base as starting position. Use this estimate if you already have a customer base. For example, you have your YouTube channel or Facebook selling page (as an individual) but you want to start a new project or establish a company.
Revenue Planning
Product Seasonality
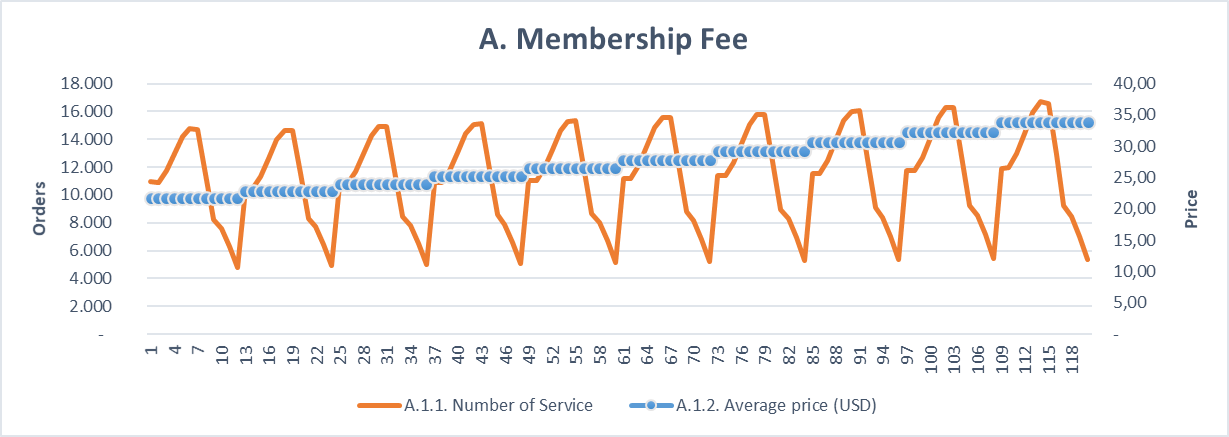
Since most of starting key drivers are estimated on a yearly level, choosing the right seasonality for selling units and price movements is another crucial assumption in the financial modeling. Estimation of key drivers for long-term planning is usually done on a yearly level (except if you are doing a budget forecast for one year). The Yearly estimated data is more available and easily compared between companies or projects. However, the ending balances of your operational and financial results are not equal on monthly basis.
What is seasonality adjustment? A seasonality adjustment is a technique of dividing yearly information into monthly series. One way of doing this is to divide the total number of sold units by 12 months, but that linear division would not be appropriate for many market segments.
For example, if you plan to have an Adrenalin webshop that sells ski and scuba diving tours to your customers, the number of selling units will be different throughout the year. I guess you would like to adjust the price also to capture preseason, season, and after-season price fluctuations.
Price Seasonality
Service/product names: you can choose the custom name of your 6 products that will be shown throughout all financial model.
Service base price: Enter the base price for your product or Service for starting year.
Sales Tax (%): If you have sales tax on your product or service (such as VAT, GTS, sales, or state tax)
Expected seasonality in price for1-12: Enter the multiplier of the base price for each month. A multiplier of 1,00X means that the monthly price will be equal to the base, while multiplies of 0,95X means that the monthly price will be 5% lower comparing to the base price.
Orders Seasonality
Total orders in starting year: enter number of orders (sales units) for 1st year of the planning horizon. (note: if you chose to estimate revenue plan based on customer base, this cell will be in gray color, meaning that it is not used for calculation).
Expected seasonality in orders for 1-12: Enter the percentage (share) of the total yearly orders for each month. A percentage of 5,00% means that the monthly orders will be equal to 5% of the total yearly order estimate. All monthly shares of orders need to add up to 100% in the collum All year. If not, a collum All Year will be in red.
Product Seasonality
Seasonality Chart
Custom Name for Fixed and Variable Cost
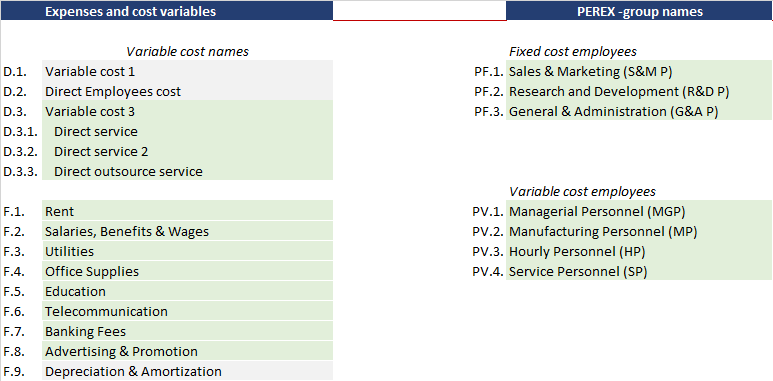
Here you can customize all names of the group of expenses in green cells. Light grey cells are fixed and cannot be changed.
Variable cost (D)
The financial model has three types of direct variable costs for you to use. The first variable cost represents the Cost of Goods Sold or the direct variable cost calculated directly as a percentage of revenue. The second is the Direct employee cost variable. Both names are fixed and cannot be changed. However, you can completely customize the names of Variable service 3, as you can estimate various variable costs choosing different drivers for each cost.
Fixed cost (F)
All fixed cost names can be customized expect those cells in grey (depreciation)
Employee cost (PF and PV)
All names of employees' costs can be customized.
Custom Name
Allocation of Direct Employee's cost
In the financial model, direct employee expenses entered in the PEREX sheet are not linked directly to each product or service. Use this table to reallocate the estimated variable cost to each product line. Some specific financial models will have an estimation that is directly linked to the product, but the general model uses percentages for allocating cost.
Direct employee Cost: enter the percentage for each product or service. The sum of all percentages needs to be equal to 100,00%
Direct employee Cost: enter the percentage for each product or service. The sum of all percentages needs to be equal to 100,00%
Allocation of Direct Employee's cost
Working Capital Assumption
Working capital assumptions are important drivers of the financial model. The drivers are used to calculate the monthly balances of trade receivable, suppliers payable, stock (if used in product), tax obligation, and other components of your short asset and liabilities that were derived from operational activities.
The models take your estimated average number of days that customers will pay you the issued invoice, or you will pay the invoice you have received to pay for incurred services (electricity, marketing, rent, etc.).
Inventory: enter the average number of days inventory stays in the warehouse
Account receivables: an average number of days clients will pay your issued invoice
Account payable: an average number of days You will pay receive invoice for the service u used.
Working Capital Drivers
Capital Assumptions
Most of the decisions about raising capital for financing business growth are done in the Financing sheet. Some general decisions about the company's capital we have put in the configuration sheet.
For example, if you decide to finance your business growth by issuing preference shares, you can choose what king of preference share will be.
Preference share type:
1. Redemeble or non redemeble
2. Cumulative or non-cumulative
Redeemable preference shares have similar dynamics as bullet loans with yearly interest and a single payment for the principal. It is called quasi-equity and according to many reporting standards it is not considered real equity (since it has an obligation to repay the initially borrowed amount). Pure preference shares are usually non-redemable.
Cumulative preference shares have the feature of accumulating all unpaid interest from the previous year into an obligation. The company will pay unpaid interest once the company's liquidity improves.
Dividend policy
If you decide to pay dividends to shareholders, here you can enter assumptions regarding the payout ratio for Shareholders.
The payout ratio (DPS/EPS) is the ratio of Dividend per share/Earnings per Share ratio. If there is a positive EPS, the dividend will be expressed as a ratio over the earnings.
Payment for cumulative and non-redeemable shares: In this cell enter your decision to initiate payment for cumulative and not paid interest on preference shares.
Capital assumptions
Business Valuation Assumptions
Business valuation assumptions are an important part of estimating the value of the business today given all assumptions we have entered into our financial model. The model does not take into account the probability of occurrence for drivers and it relies upon estimated Free cash flow throughout estimate horizon and compensation for future business growth.
We are not going to explain in detail the financial theory behind it (at least not here in guidelines) but we will simply explain what kind of parameters you need to enter to get an estimate.
Generally, you can choose between two methods;
1. Direct Equity Method
2. Direct Investment Method
The direct equity method uses free cash flow to the owners of equity holders, which is left after preference shares are being paid. This method estimates how much is the company is valued by Equity holders. Using this method, we apply to discount factor (cost of capital) only on equity holders' desirable return on equity.
The direct Investment method uses free cash flow to all invested capital parties, including the loan obligations. Since we want to know the value of all investors (debt and capital holders), we calculate the weighted average of capital cost (WACC) by using the CAMP model.
If you finance a business growth with a combination of debt and equity, you may use the direct equity method.
Input variable for CAMP model
In simple words, for SMEs that are not listed in the stock exchange, we want to know what is combined cost of capital for both equity holders and debtors. It has to be some weighted average of both party's costs.
to get approximate input variables for your company or project, you need to look at similar companies or projects. It is not easy to find the right inputs, but you can approximate numbers in a way that is easily explainable to investors. After all, it is important to know how did you come up with discounting factors that are calculated on the business valuation sheet.
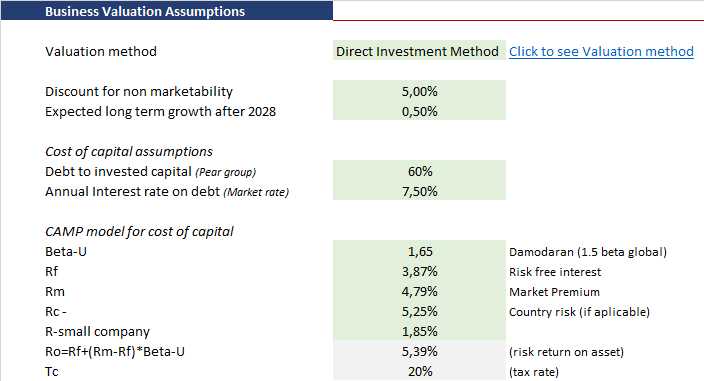
Discount for non-marketability: ad on risk for lack liquidity. it is harder to sell someone's shares if the company's shares are not tradable on the stock exchange.
Expected long term growth: the expected growth after the end of the planning horizon
Debt to invested capital (peer group): average debt to equity ratio for similar companies on the market.
Annual interest on Debt: the average interest rate on bank long-term loans today.
Beta-U: is a measure of variance in financial instruments that are listed on the stock exchange comparing to the market (systematic risk). In our world of SMEs, it is a measure of volatility (risk). 0,5 -0.75 is low risk, from 0,75 -1 I moderate risk, above 1,00 is higher volatility risk.
RF-Risk free: Risk-free interest rate on the market. It is a most riskless instrument, like the yield on a 10-year US government bond (currently 2,5%) or other long-term government instruments.
Rm: Average Return on market
Rc: Country risk premium. If you have investors from abroad, it is likely that country risk will be taken into consideration from their side (Optional).
R-small company: an addon risk factor for small companies ( Optional, usually 1,5%)


