- Customer Dashboard
Customer Dashboard
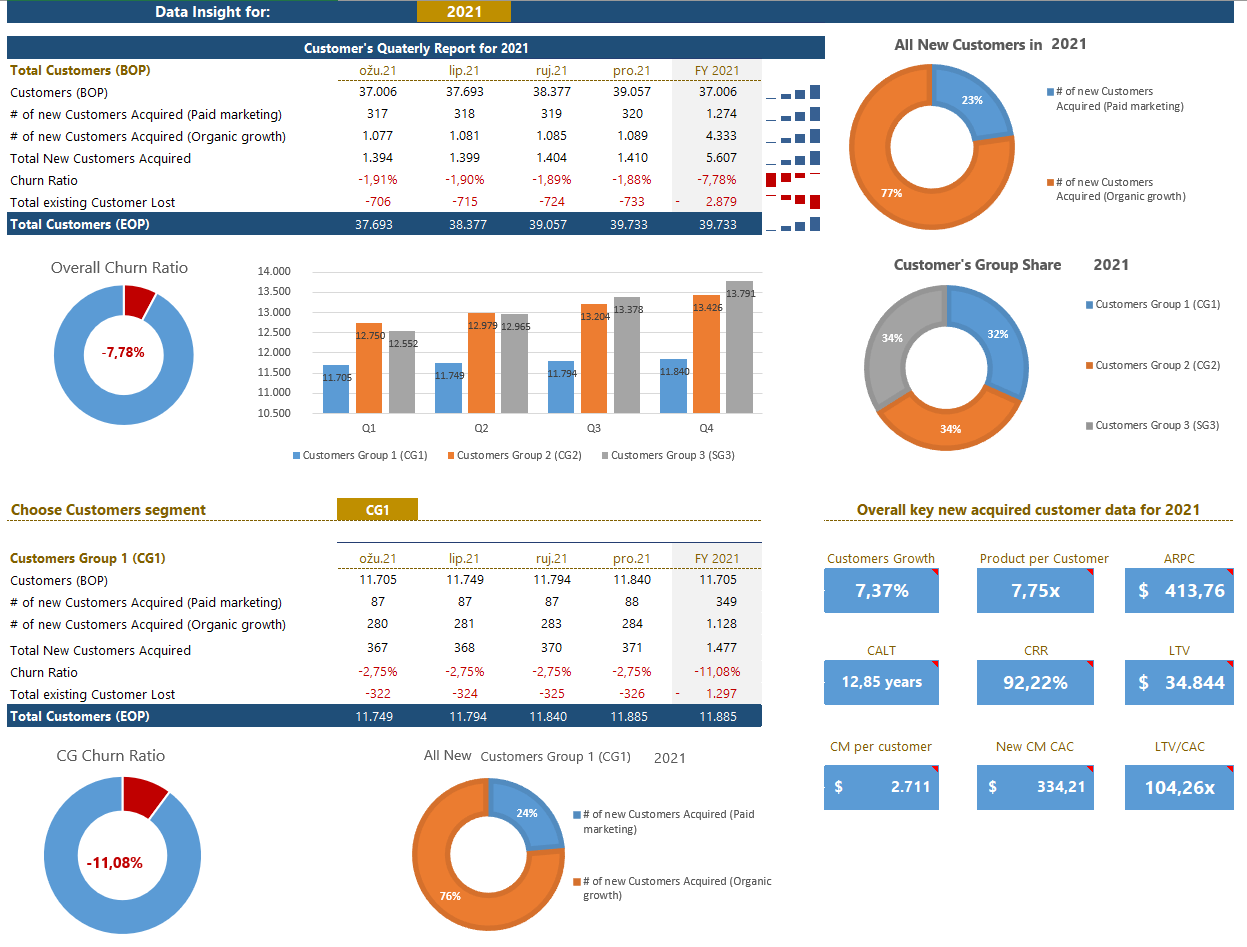
Customer Dashboard serves as the main controlling panel for overviewing Customer data. It is important to estimate well-balanced customer growth and derives key performance indicators that you will use for justifying your assumptions regards customer base. If your business strategy is found on paid marketing, then LTV/CAC ratio is something that you should watch carefully.
Main features
- Ability to see Customer Dashboard information for each year.
- Overview of quarterly movement of customers base
- Overview of planned churn rate and composition of the customer base for the chosen year.
- Overview of detailed movement of each customer segment per chosen year.
- LTV/CAC ratio for each year.
Dynamic Dashboard
Customer Dashboard gives a detailed overview of all important estimations in customer growth. On the left side, you can select any year from the planned period and inspect quarterly results of total new customers acquired through paid or organic channels and the estimated churn ratio for each quarter.
Since the model has built 3 customer subsegments, you can have an overview of the charge of each subgroup segment as well as detailed movements of new customers and churn rate.
The model has built 12 key metrics for controlling estimation of customer base and how much you spend on paid channels and how much is Lifetime Value (LTV) per customer.
Some of the metrics are;
-Customer Growth
- Product per Customer
- Average Revenue per Customer (ARPC)
- Lifetime of Revenue (LTR)
- Lifetime Value (LTC)
- Customer Acquisition Cost (CAC)
- Customer Retention Rate (CRR)
Dynamic Dashboard
Yearly overview
On the left side of the Customer Dashboard, there is a yearly overview of the key performance indicators in estimating the Customers base.
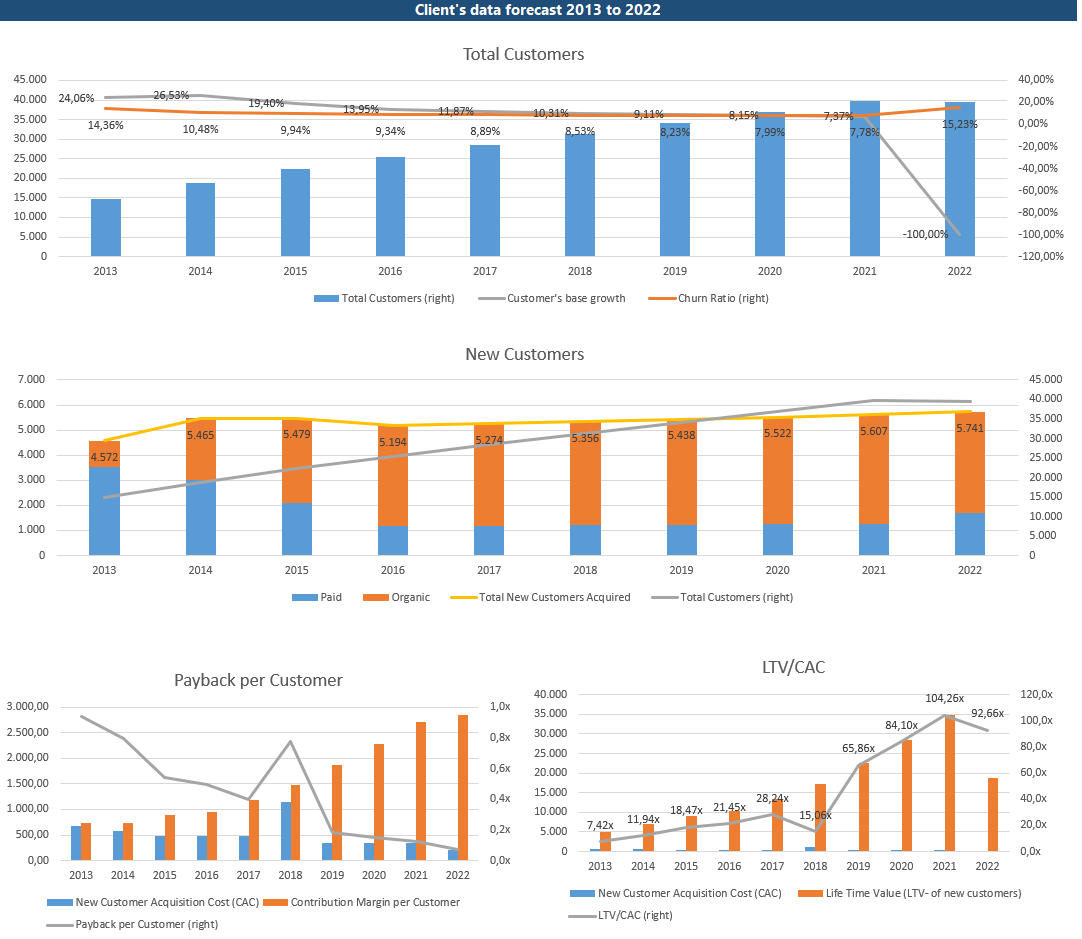
The first diagram shows a yearly overview of the total customer base at the end of the calendar year, Customer base growth, and estimate churn ratio.
Second diagram. represents the distribution of new customers by paid or organic channel compared with the total customers base.
Last two diagram represents the acquisition cost you invested into a new customer, Contribution margin and payback time, as well as change in Lifetime value and LTC/CAC ration over the planned time.
If you need more monthly data for each planned year, you can examine it in detail in customer-s-life-time-value


