Net Revenue
Net Revenue
Net Revenue is equal to the total revenue of all products, (excluding the added tax), deducted the on sale discounts, refunds, and returns that are directly deductible from sales. Some businesses deduct the cost of goods sold, but we created a whole section for calculating direct variable cost.
Main features
- Ability to enter beginning and end of cost duration.
- Ability to chose a driver based on the number of units or total revenue
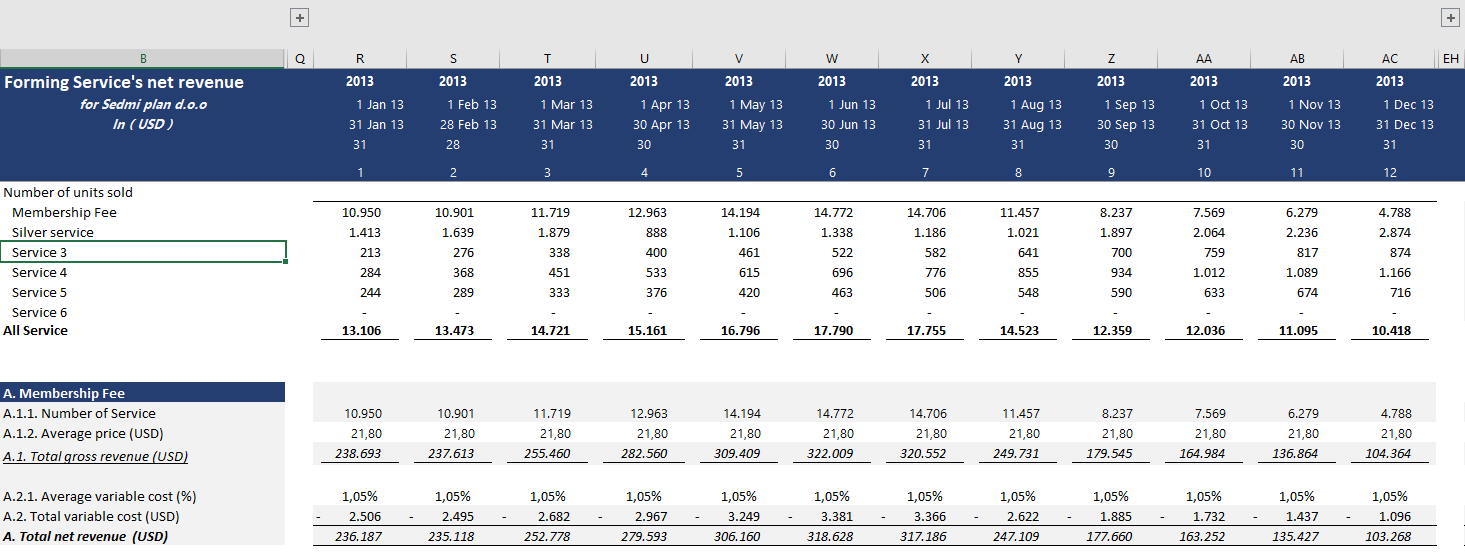
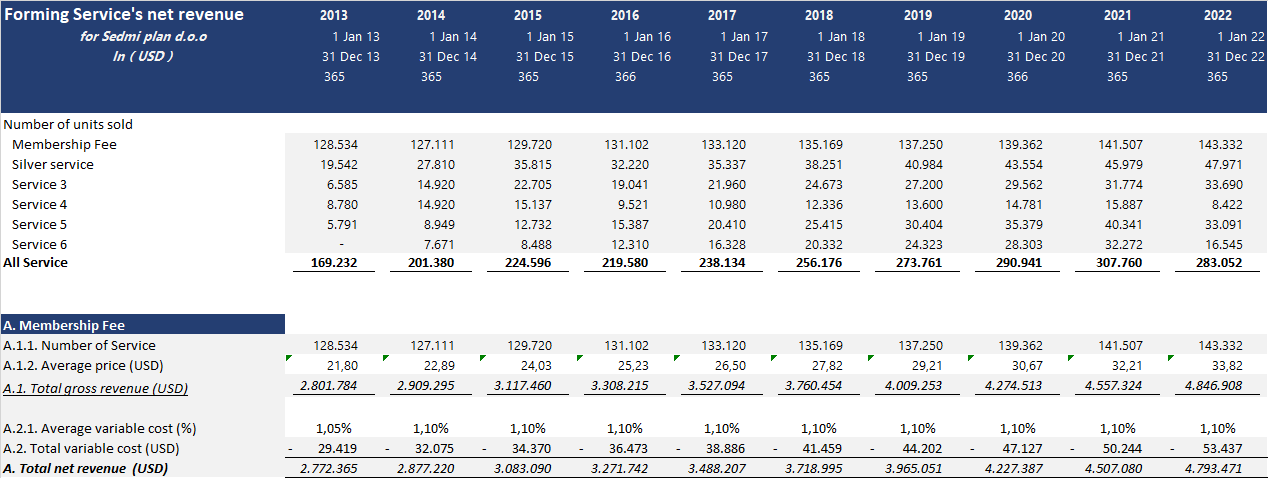
- Forsee monthly and yearly forecast on the same sheet.
Calculating net revenue
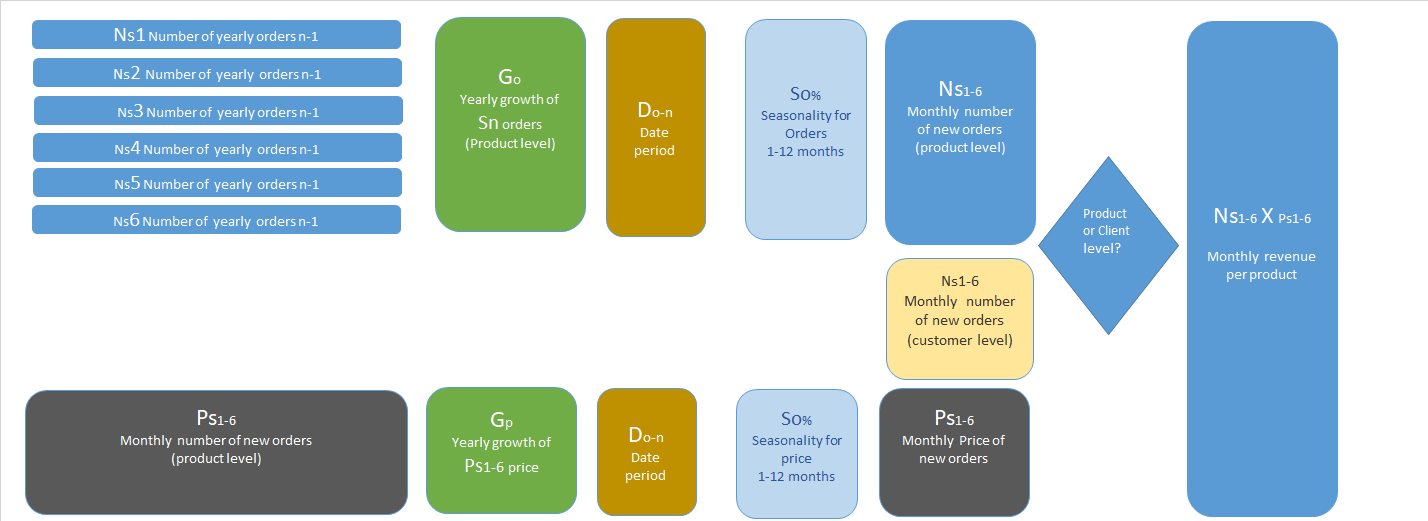
As already explained, depending on your decision of estimating net revenue in the configuration section, you may choose between customer-based or product level. Both ways of estimating revenues are correct, depending on what kind of data you have available at moment. The diagram below shows both components of revenue estimation model.
Net revenue flow
Let's summarised the Revenue movements in the model. Change in revenue over time is based upon:
- number orders sold (can be estimated directly or through Customer model)
- change in the price of used products or services over time
- start and end date of offering product or service
- seasonality in orders
- seasonality in the price of product or service
Main Assumption Drivers
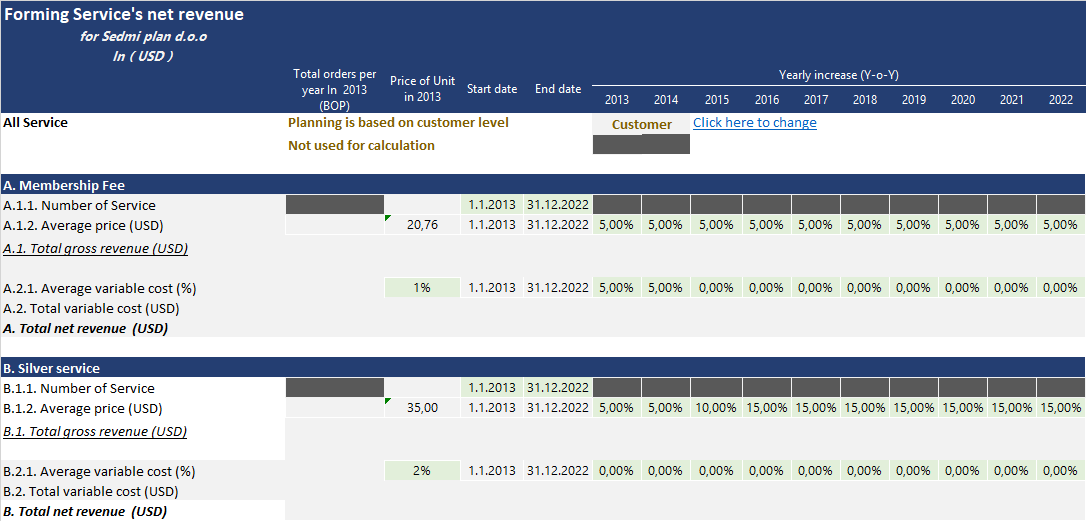
If you choose to estimate revenue as per customer level base, then the cells for entering yearly increase in orders will be painted in grey. This is due to fact that the number of orders is estimated in the customer section. Contrary, if you choose to estimate revenue per product order, then you start with the total number of orders in the first plan year (configuration section) then you enter planed yearly increase in orders.
There are a total of 6 available positions to estimate product order and revenue or groups of products. For example, if you have a webshop of more than thousands of products, you can group than into similar groups that have similar market trends or sales patterns.
Each product has its start and end date. It is useful if you start with some products at the beginning of the planning period, and plan to introduce some more advanced services in 3rd year. Using the end of the date for products is useful if you plan to utilize the total life cycle of the product ending with product withdrawal and introduction with a new replacement product.
The product base price level for the first year is placed in the configuration section. Based on that price, you estimate the yearly price movements for each product in the respective year.
Total variable cost (for service) or Total cost of goods sold -COGS (for physical goods) are drivers for estimating first direct variables cost (model has 3 groups of variable cost).
Entering main drivers
Main overview reports
Once you enter all drivers for estimating product or services revenue, including the variable cost, you can see if your drivers meet your planned monthly or yearly targets. More detailed information about revenue is placed on the Revenue Dashboard, where you can see revenue segmentation, Quarterly data for numbers of orders, revenue, and gross margins for the chosen year.


