- Main Dashboard
Main Dashboard
Main Dashboard serves as the main control panel where all key information about the financial plans is placed into one view. Without having a dashboard, it will be difficult to see how well did you estimate your financial plan.
Main features
- Ability to see main Dashboard information for each year
- Ability to choose cumulative and period quarterly data
- Main quarterly planned data for P&L, balance sheet, and Cashflow
- Key operational ratios for the respective year
- Overview of planned Revenue, growth rate, cash flow, and investment
Dynamic Dashboard
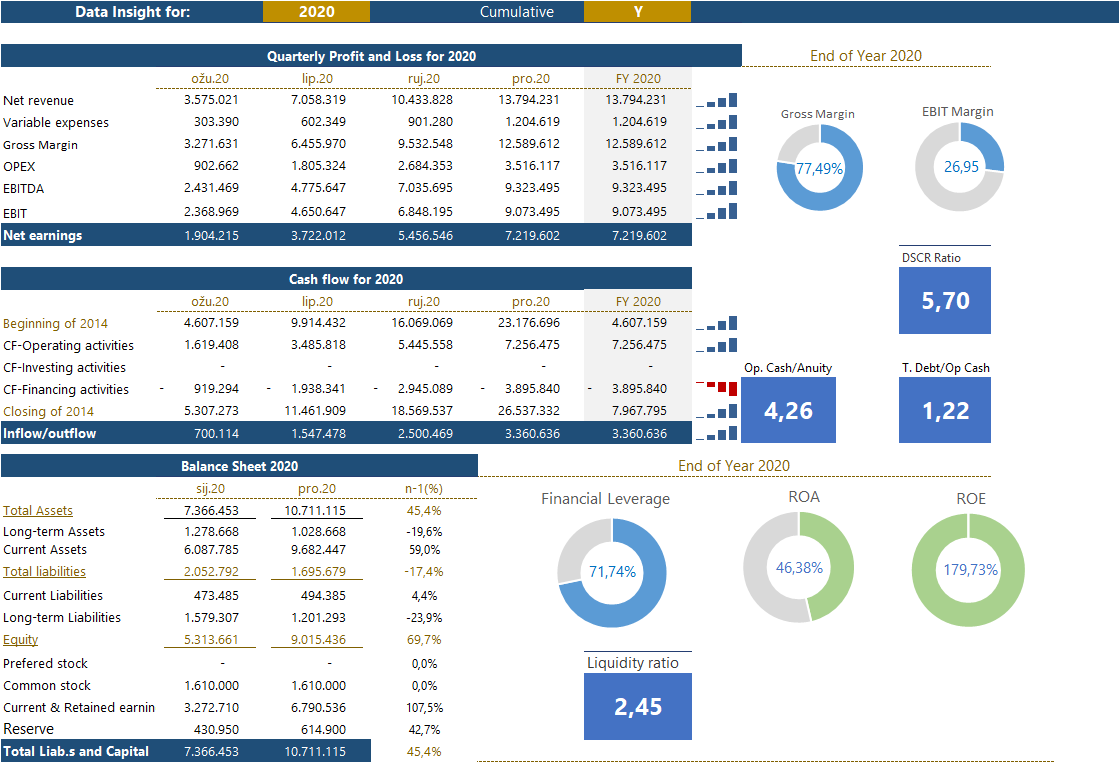
One of the coolest features of the Main Dashboard is changing the in-depth quarterly financial view for a particular year. In addition to, you can choose whatever you want to see quarter by quarter or cumulative results.
On the right side of the Dashboard you can inspect how did you plan Profit and loss statements, Cash flow and balance sheet results, and respective key operational performance indicators.
On the right side of the Dashboard you can inspect how did you plan Profit and loss statements, Cash flow and balance sheet results, and respective key operational performance indicators.
Dynamic Dashboard
Main Dashboard
Yearly overview
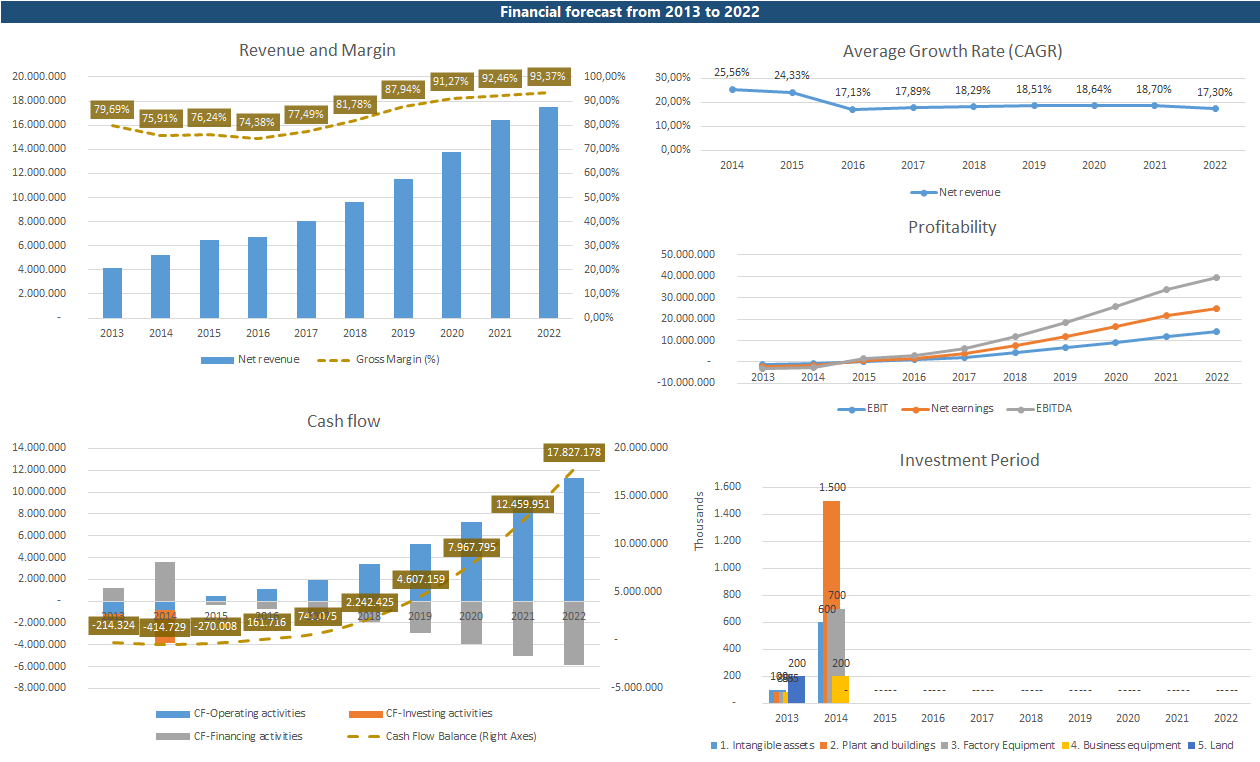
The left side of the main Dashboard shows 4 important metrics displayed on diagrams. For every good balanced financial plan, it is important to control the following:
- Revenue and margin -What is the level of revenue and movement of gross margin over the year.
- Revenue Average growth rate - what is CAGR on yearly basis.
- Cashflow - Composition of cash flow (operational, financial, and investment) as well as cash flow balance over the year.
- Investment - It shows the level and timing of investment (including investment type)
Yearly overview
If you need more monthly data for each planned year, you can examine it in detail in the following dynamic reports:
- Cash Flow Statement
In addition to that, we have developed dynamic financial report statements, where you can choose monthly, quarterly, semi-annually, and annually reporting periods.
In addition to that, we have developed dynamic financial report statements, where you can choose monthly, quarterly, semi-annually, and annually reporting periods.


