- Business Valuation Dashboard
Business Valuation Dashboard
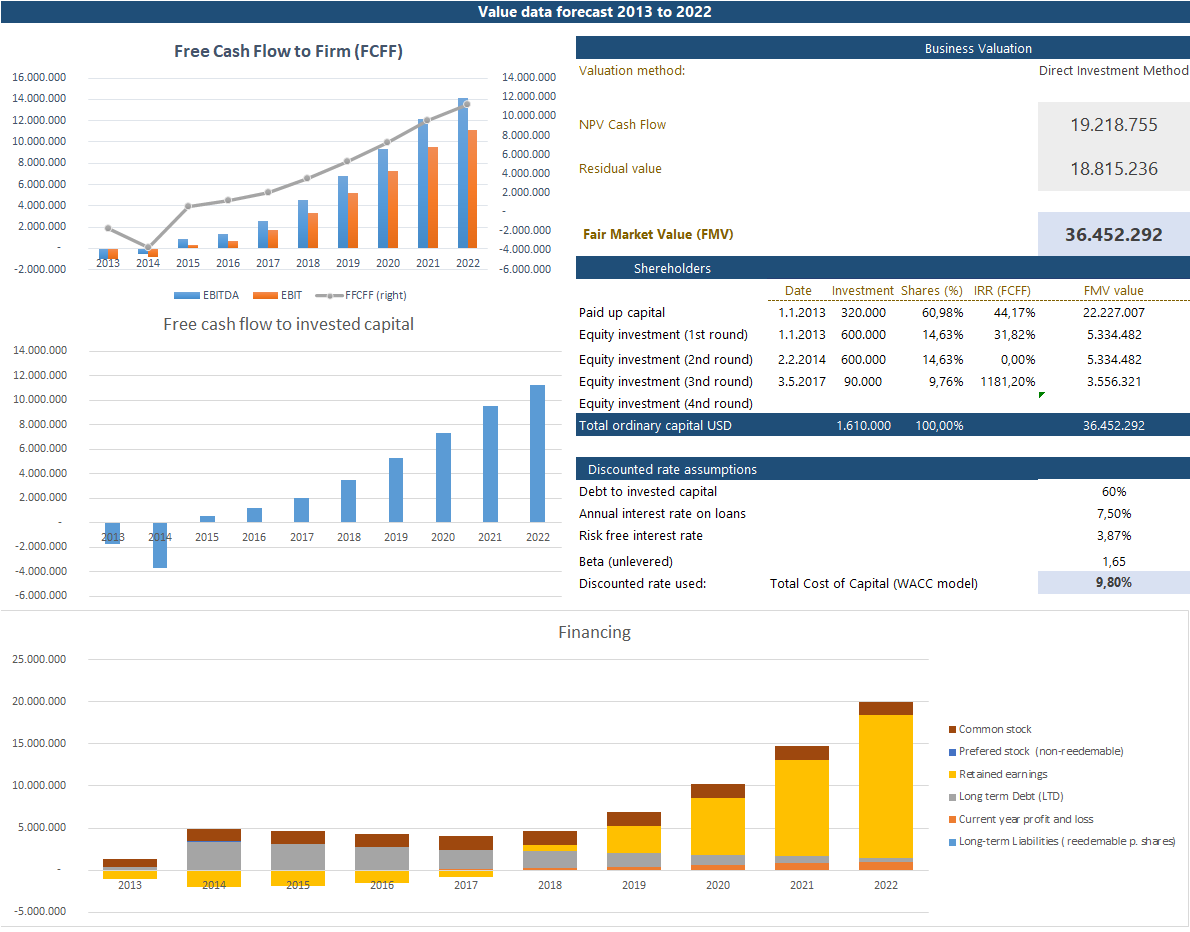
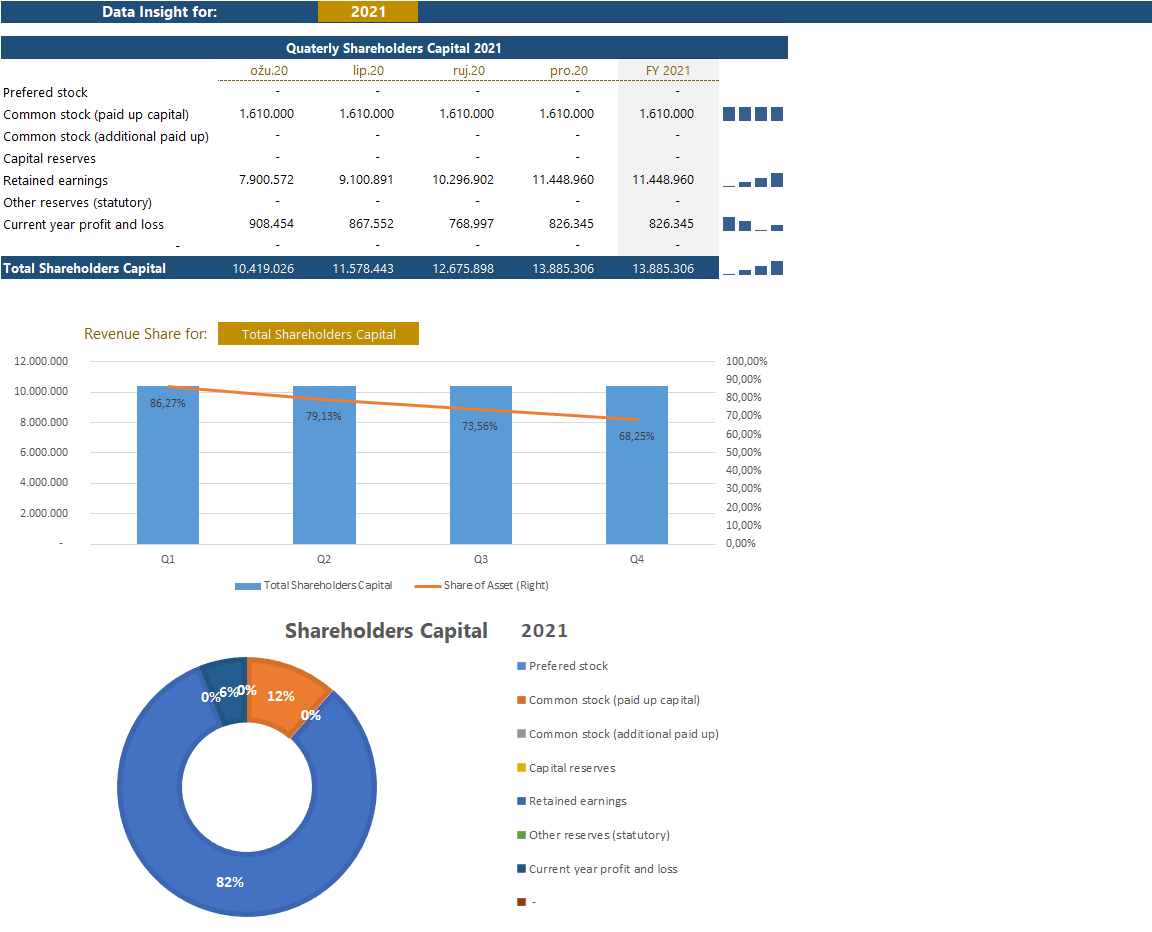
Business Valuation Dashboard gives an overall insight into Company valuation and quarterly movements of shareholders equity for a given year. On this Dashboard, you can see investors' rounds and their respective return on investment (IRR), stakes, and Enterprise value at the end of the planning period.
Main features
- Enterprise value and Key business valuation metrics.
- Quarterly change in Shareholders' equity for each year.
- Investors round and respective IRR, company shares at the end of planning year.
- Discounted factor assumptions.
- Shareholder's capital to revenue ratio for each year.
Dynamic Dashboard
On the left side of the Business Valuation Dashboard, we provided business enterprise value and how much is derived from operational cash flow, and how much is derived from the residual value at the end of the planned horizon. In addition, we provided an estimated cash flow to the firm (FCFF) and free cash flow to invested capital over the planned horizon in order to see a distribution of incoming cash flow through the time horizon.
Shareholders' table shows all investment rounds with and their respective investment date, transaction value, profitability in terms of IRR, and fair market value depending on equity share at the end of the planned horizon. You can also see the discounted factor assumption, depending on chosen valuation method.
The financing diagram shows the financing structure for each year in the planned period.
Yearly overview
Yearly overview
In addition to business valuation, we also provided an overview of quarterly movements of shareholders' capital with the composition of capital for a given year. You can see the respective capital to revenue ratio for each capital type.


